
Lesson 02
【Arduino連携編 その2】
こんにちは、管理人のomoroyaです。
Lesson 01にてサンプルスケッチを利用してProcessingとArduinoを連携して遊びました。

Lesson 02も引き続きサンプルスケッチを利用して遊んでいきます。
しばらくは、どんなことができるのか体験です。
Lesson 01と同様にProcessingの構文の理解は後回しです!
本日も内容理解は全て吹っ飛ばし、まずはどんなことができるのか体験です。
では、さっそく行って見ましょう。
Processingを始めようと考えている方。
ネット情報のみでも十分に学習可能です。
手元に参考書がほしいと考えている場合は下記の2冊程度で十分と考えます。


はじめに
本LessonでもLesson 01同様にArduinoの「スケッチ例」にあるサンプルを利用します。
※統合環境であるIDEには、いくつかのサンプルスケッチがあります。
サンプルスケッチを読み出して実行するだけで、
「Arduino」と「Processing」を連携して遊ぶことができます。
どんなことができるのか確認するにはちょうど良い内容です。
公式ホームページのチュートリアルに説明があります。

上記ページの「Built-In Examples」⇒「4. Communication」と移動してください。
Communication用のTutorialが色々あります。
この中から、Processingと連携できるサンプルスケッチを選んで遊びます。
1.サンプルスケッチで遊ぶ。
2.どんなことができるのか体験する。
3.やってみたいことを想像する。
その後、本格的に学習していきます。
本Lessonでは、「4. Communication」にある「Graph」で遊びます。
「コンピュータにデータを送り、Processingでグラフ化する」という内容のチュートリアルとなります。
「Graph」で遊ぶための回路
公式の英語サイトを読まなくてもできるように本Lessonでは解説していきます。
英語が気にならない場合、公式ページを読んでいただいて遊ぶことができます。
先ほどの公式ページに実体配線図も記載されています。
「Graph」はポテンショメータ(可変抵抗器)とアナログ入力A0を利用します。
ポテンショメータとアナログ入力については以下で解説しています。
動作内容は以下となります。
- ポテンショメータの出力電圧をアナログ入力で読み取りデジタル値に変換
- 変換したデータをパソコンに送る
- Processingでデータをグラフ化
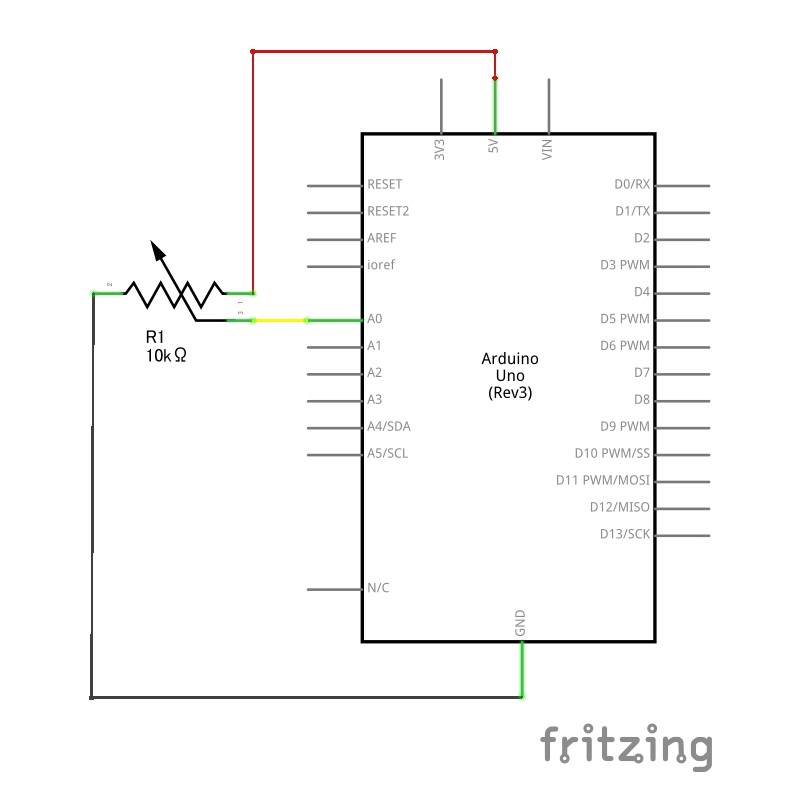
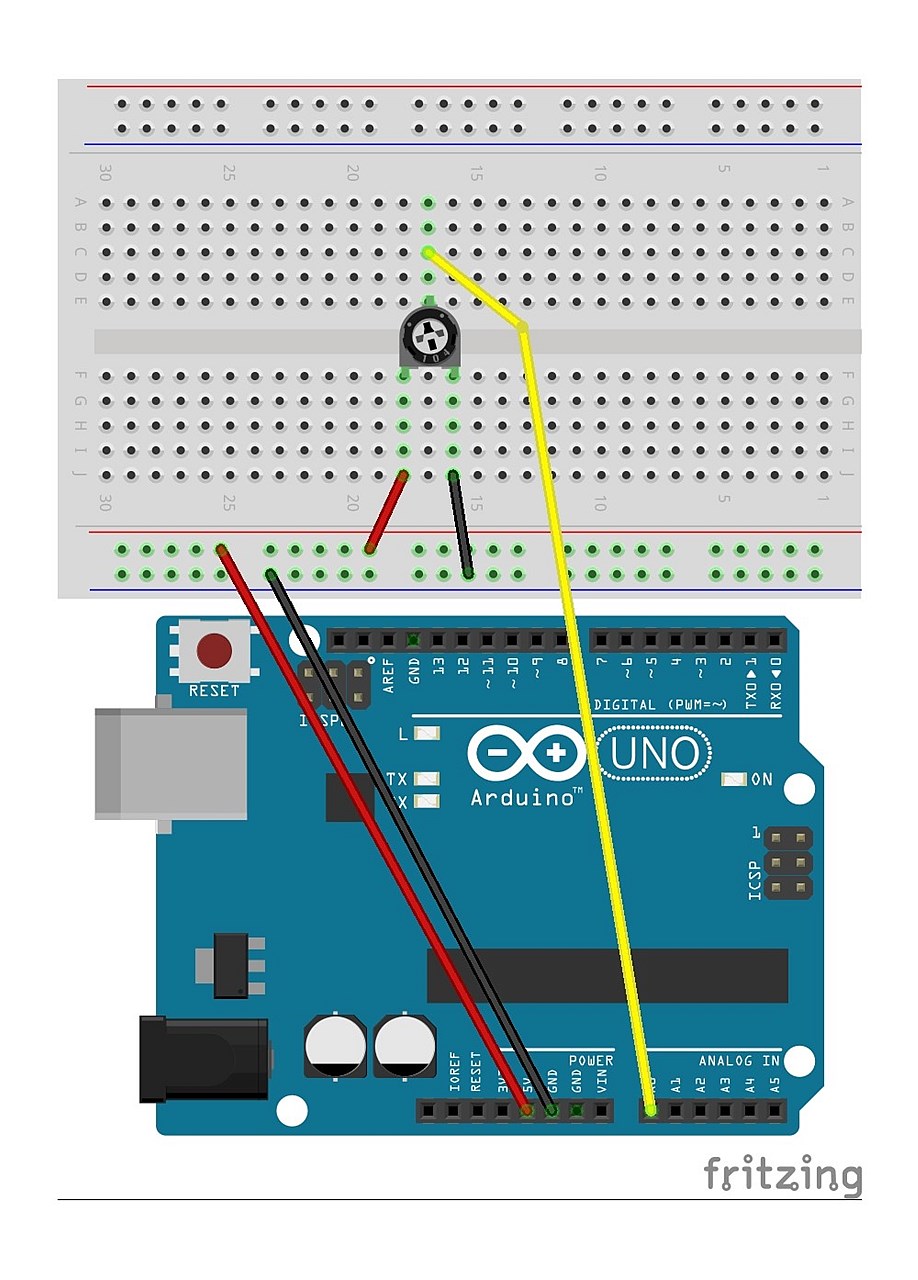
「Graph」に対応した回路図とブレッドボード図がこちらとなります。
管理人がFrizingを使って描いた回路図となります。
ポテンショメータのみの単純な回路です。
「Graph」サンプルスケッチ 読み出し
Arduinoの「IDE」を立ち上げてください。
以下で「Graph」のサンプルスケッチが読み出されます。
「ファイル」⇒「スケッチ例」⇒「04.Communication」⇒「Graph」
こちらが読み出したサンプルスケッチ。
下記サンプルスケッチはArduino用のスケッチとProcessing用のスケッチが両方記載されています。
Processing用のスケッチはコメントアウトされていますので、Processingの「IDE」にコメントアウトされた部分を記載すればよいだけとなります。
/*
  Graph

  A simple example of communication from the Arduino board to the computer: The
  value of analog input 0 is sent out the serial port. We call this "serial"
  communication because the connection appears to both the Arduino and the
  computer as a serial port, even though it may actually use a USB cable. Bytes
  are sent one after another (serially) from the Arduino to the computer.

  You can use the Arduino Serial Monitor to view the sent data, or it can be
  read by Processing, PD, Max/MSP, or any other program capable of reading data
  from a serial port. The Processing code below graphs the data received so you
  can see the value of the analog input changing over time.

  The circuit:
  - any analog input sensor attached to analog in pin 0

  created 2006
  by David A. Mellis
  modified 9 Apr 2012
  by Tom Igoe and Scott Fitzgerald

  This example code is in the public domain.

  http://www.arduino.cc/en/Tutorial/Graph
*/

void setup() {
  // initialize the serial communication:
  Serial.begin(9600);
}

void loop() {
  // send the value of analog input 0:
  Serial.println(analogRead(A0));
  // wait a bit for the analog-to-digital converter to stabilize after the last
  // reading:
  delay(2);
}

/* Processing code for this example

  // Graphing sketch

  // This program takes ASCII-encoded strings from the serial port at 9600 baud
  // and graphs them. It expects values in the range 0 to 1023, followed by a
  // newline, or newline and carriage return

  // created 20 Apr 2005
  // updated 24 Nov 2015
  // by Tom Igoe
  // This example code is in the public domain.

  import processing.serial.*;

  Serial myPort;        // The serial port
  int xPos = 1;         // horizontal position of the graph
  float inByte = 0;

  void setup () {
    // set the window size:
    size(400, 300);

    // List all the available serial ports
    // if using Processing 2.1 or later, use Serial.printArray()
    println(Serial.list());

    // I know that the first port in the serial list on my Mac is always my
    // Arduino, so I open Serial.list()[0].
    // Open whatever port is the one you're using.
    myPort = new Serial(this, Serial.list()[0], 9600);

    // don't generate a serialEvent() unless you get a newline character:
    myPort.bufferUntil('\n');

    // set initial background:
    background(0);
  }

  void draw () {
    // draw the line:
    stroke(127, 34, 255);
    line(xPos, height, xPos, height - inByte);

    // at the edge of the screen, go back to the beginning:
    if (xPos >= width) {
      xPos = 0;
      background(0);
    } else {
      // increment the horizontal position:
      xPos++;
    }
  }

  void serialEvent (Serial myPort) {
    // get the ASCII string:
    String inString = myPort.readStringUntil('\n');

    if (inString != null) {
      // trim off any whitespace:
      inString = trim(inString);
      // convert to an int and map to the screen height:
      inByte = float(inString);
      println(inByte);
      inByte = map(inByte, 0, 1023, 0, height);
    }
  }

*/
「Graph」 Arduino用のスケッチを抜き出し
Arduino用のスケッチ部分のみを抜き出したのがこちら。
下記をArduino用の「IDE」に記載してArduinoに書き込んでください。
/*
  Graph

  A simple example of communication from the Arduino board to the computer: The
  value of analog input 0 is sent out the serial port. We call this "serial"
  communication because the connection appears to both the Arduino and the
  computer as a serial port, even though it may actually use a USB cable. Bytes
  are sent one after another (serially) from the Arduino to the computer.

  You can use the Arduino Serial Monitor to view the sent data, or it can be
  read by Processing, PD, Max/MSP, or any other program capable of reading data
  from a serial port. The Processing code below graphs the data received so you
  can see the value of the analog input changing over time.

  The circuit:
  - any analog input sensor attached to analog in pin 0

  created 2006
  by David A. Mellis
  modified 9 Apr 2012
  by Tom Igoe and Scott Fitzgerald

  This example code is in the public domain.

  http://www.arduino.cc/en/Tutorial/Graph
*/

void setup() {
  // initialize the serial communication:
  Serial.begin(9600);
}

void loop() {
  // send the value of analog input 0:
  Serial.println(analogRead(A0));
  // wait a bit for the analog-to-digital converter to stabilize after the last
  // reading:
  delay(2);
}
「Graph」 Processing用のスケッチを抜き出し
Processing用のスケッチ部分のみを抜き出したのがこちら。
下記をProcessing用の「IDE」に記載してください。
/* Processing code for this example

  // Graphing sketch

  // This program takes ASCII-encoded strings from the serial port at 9600 baud
  // and graphs them. It expects values in the range 0 to 1023, followed by a
  // newline, or newline and carriage return

  // created 20 Apr 2005
  // updated 24 Nov 2015
  // by Tom Igoe
  // This example code is in the public domain.
*/

  import processing.serial.*;

  Serial myPort;        // The serial port
  int xPos = 1;         // horizontal position of the graph
  float inByte = 0;

  void setup () {
    // set the window size:
    size(400, 300);

    // List all the available serial ports
    // if using Processing 2.1 or later, use Serial.printArray()
    println(Serial.list());

    // I know that the first port in the serial list on my Mac is always my
    // Arduino, so I open Serial.list()[0].
    // Open whatever port is the one you're using.
    myPort = new Serial(this, Serial.list()[0], 9600);

    // don't generate a serialEvent() unless you get a newline character:
    myPort.bufferUntil('\n');

    // set initial background:
    background(0);
  }

  void draw () {
    // draw the line:
    stroke(127, 34, 255);
    line(xPos, height, xPos, height - inByte);

    // at the edge of the screen, go back to the beginning:
    if (xPos >= width) {
      xPos = 0;
      background(0);
    } else {
      // increment the horizontal position:
      xPos++;
    }
  }

  void serialEvent (Serial myPort) {
    // get the ASCII string:
    String inString = myPort.readStringUntil('\n');

    if (inString != null) {
      // trim off any whitespace:
      inString = trim(inString);
      // convert to an int and map to the screen height:
      inByte = float(inString);
      println(inByte);
      inByte = map(inByte, 0, 1023, 0, height);
    }
  }
「Graph」 サンプルスケッチの実行
実行手順が以下となります。
- Arduino用のスケッチ部分をArduino用のIDEにコピーしてArduinoに書き込み。
※回路接続のため電源供給を一旦止める。 - 回路作成しArduinoと接続。
- Arduinoへ電源供給
- Processing用のスケッチ部分をProcessing用のIDEにコピーして実行。
これで、問題なく動くはずです。
「Graph」 サンプルスケッチ実行結果
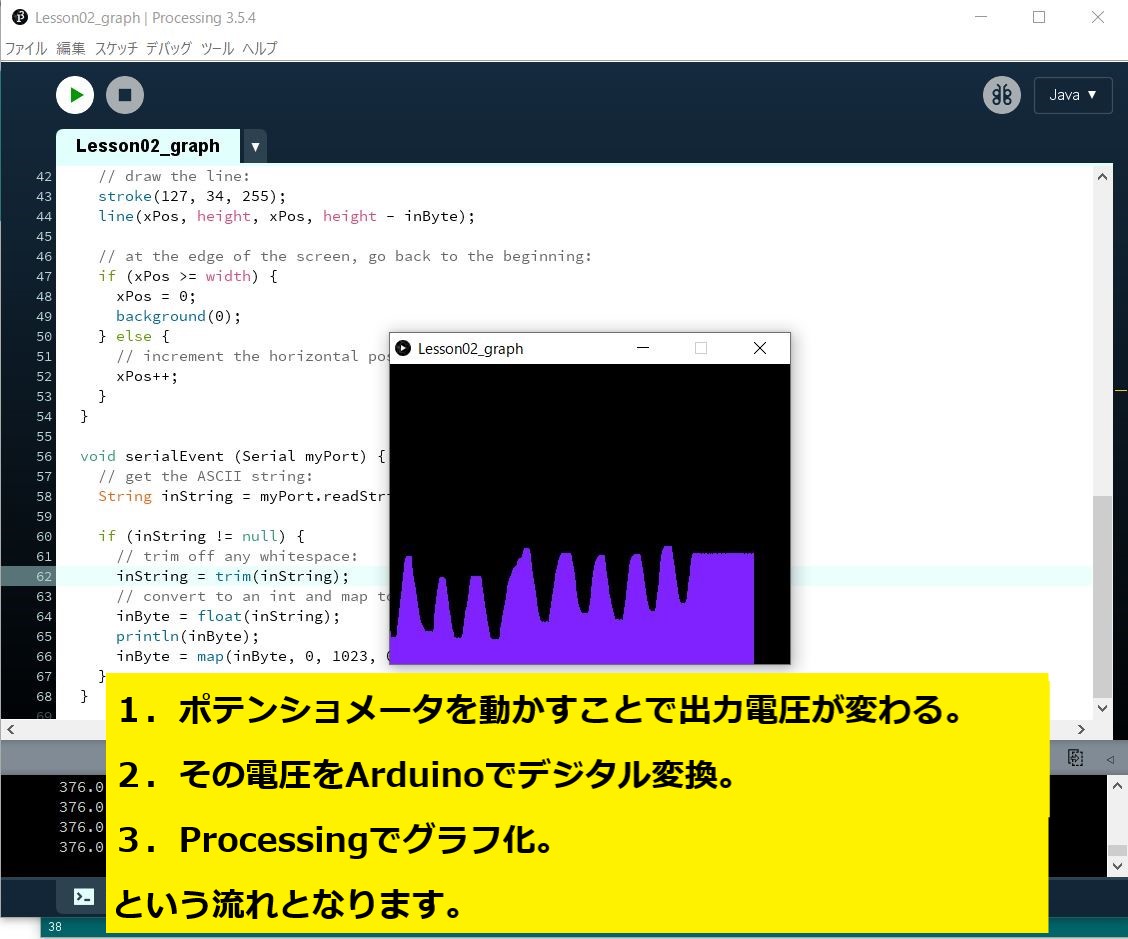
Processingを実行するとパソコンの画面中央にグラフのグラフィックが現れます。
ポテンショメータのつまみの動きにあわせてGraphが変化します。
- ポテンショメータを動かすと電圧値が変動
- その電圧値をArduinoでデジタル値に変換
- Processingでグラフ化
という流れになっています。
なるほど、電子部品の特性にあわせてProcessingを使えばい色々と表現の幅が広がりそうです。
まとめ
Lesson 02【Arduino連携編 その2】はここまで。
やっぱりProcessingとの連携、面白い。
次回、Lesson 03もサンプルスケッチを使って遊びます。
まだ、いくつかサンプルスケッチがあります。

Processingを始めようと考えている方。
ネット情報のみでも十分に学習可能です。
手元に参考書がほしいと考えている場合は下記の2冊程度で十分と考えます。
最後に
疑問点、質問などありましたら気軽にコメントください。
この電子部品の解説をしてほしい!などなどなんでもOKです。
リンク切れ、間違いなどあればコメントいただけると助かります。
Arduino入門編、番外編、お役立ち情報などなどサイトマップで記事一覧をぜひご確認ください。
Arduino入門編、Arduino入門編2で使用しているUNOはAmazonにて購入可能です。
Arduino入門編では互換品を使用。
Arduinoはオープンソース。
複製して販売するのもライセンス的に問題なし。
そのため互換品の品質も悪くなく、それでいて値段は安いです。
正規品本体の値段程度で豊富な部品が多数ついています。
学習用、遊び用、お試し用には安価な互換品がおすすめです。
ELEGOO UNO キット レベルアップ チュートリアル付 uno mega2560 r3 nanoと互換 Arduino用


上記のものでも十分に多数の部品が入っていますが、最初からもっと多数の部品が入っているこちらもお勧めです。


Arduino入門編2では「Arduino UNO R4 Minima」「Arduino UNO R4 WIFI」にて遊ぶため今のところは正規品を使用。(まだ互換品が・・・ほぼない)


Amazonでお得に買う方法
Amazonでお得に購入するならAmazon Mastercard、Amazonギフト券がおすすめです。
時期により異なりますが、様々なキャンペーンを実施しています。
\Amazonギフト券/
Amazonギフトカード キャンペーン
\Amazon Mastercard お申込み/
Amazon Mastercard 申し込み
いずれの場合もプライム会員である方がお得!!
\Amazon Prime 30日間の無料会員を試す/
無料会員登録


コメント