Lesson 22
【脈拍・心拍センサ】
こんにちは、管理人のomoroyaです。
最近、記事を更新する時間が限られている管理人にです!
Lesson 21は【ジョイスティック】ということでポジョイスティックの動作をProcessing上で表現するスケッチを描きました。
また、Lesson 19からは「Arduino」 → 「Processing」へと情報の流れもこれまでと逆パターン。
Lesson 22にて使用する電子部品は【脈拍・心拍センサ】です。
本LessonではArduino入門編で遊んだ「脈拍・心拍センサ」を使って心拍をProcessingで表現して遊びます。
Lesson 19~21でなんとなくつかめてきたと思います。
徐々に色々な電子部品で遊んでいきます。
本Lessonも情報の流れは、「Arduino」 → 「Processing」。
Arduinoで取得したデータをProcessingで処理する学習。
前回同様、理解しやすいように使用する電子部品は少なくします。
「脈拍・心拍センサ」のみを使った回路で学習していきましょう。
Processing学習の最終目標は、「6軸モーションセンサ」との連携です。
Lesson 14以降を学習することでLesson 01 ~ Lesson 06【Arduino連携変 そのX】で遊んだスケッチも理解できるようになるはず。
これからのLessonを楽しみましょう!
Processingを始めようと考えている方。
ネット情報のみでも十分に学習可能です。
手元に参考書がほしいと考えている場合は下記の2冊程度で十分と考えます。


はじめに
Lesson 14からはArduinoと一緒に学習していきます。
Arduinoの詳細な解説は「Arduino入門編」にて確認してください。
本Lessonでは脈拍・心拍センサで取得した脈拍・心拍の動きをProcessingに表現させます。
まあ、Arduino 入門編で学習した脈拍・心拍センサが考えていた以上に精度があり、これをProcessingで表現したら面白いかなって思い遊ぶことにしました。
まずは、入門編の【脈拍・心拍センサ】を学習しておくことをおすすめします。
Lesson 21 目標
本Lessonの目標は以下の2点です。
2.脈拍・心拍センサの復習
3.脈拍・心拍センサで取得した脈拍・心拍の動きをProcessingで表現する
本Lessonの学習に必要な物
本Lessonに必要となる電子部品を列挙します。
- USB接続用のPC(IDE統合環境がインストールされたPC)
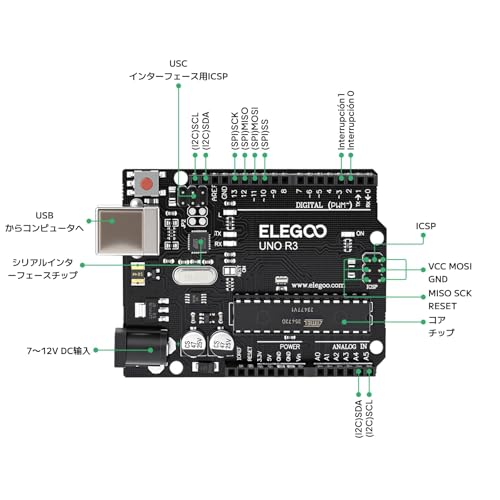
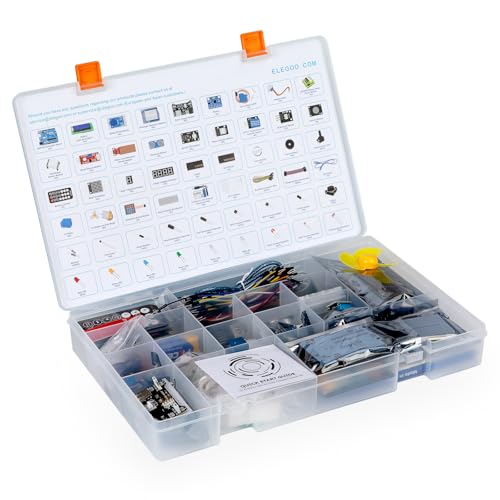
→管理人が勝手に比較したBTOメーカーを紹介しています。 - UNO R3(以下UNO)、おすすめUNO互換品(ELEGOO)
- PCとUNOを接続するUSBケーブル
- ブレッドボード安価(大)、ブレッドボード安価(中)
※おすすめブレッドボード(大)、おすすめブレッドボード(中) - M-M Jumper wire(UNOと部品をつなぐための配線)
- M-F Jumper wire(UNOと部品をつなぐための配線)
- M-F M-M F-F セット Jumper wire(UNOと部品をつなぐための配線)
- おすすめ抵抗600個セット
※抵抗はLessonによって必要ないLessonもあります。
- 脈拍センサー
- 330Ω 1本
※330ΩはLEDを使用する場合に必要
最近センサ関係の電子部品が手に入りずらい。
Amazonに在庫がない。
出荷元がAmazonではない。
そんな場合は中国からの輸入品になると考えられるため気長に待ってください。


Amaozn以外の国内で探してもあります。
しかし、高いです・・・。
Aliexpressなどでの購入に抵抗感がなければ、そちらもあり。
管理人はトラブルが面倒なので、多少高くでも返金が容易なAmazonで購入です。
Amazonであれば、最悪「Amazonマーケットプレイス保証」がありますので・・・。
実践 回路作成
最初に回路図を確認してください。
次に、回路図に合わせて部品を接続します。
最後にスケッチ(コード)を描きましょう。
ジョイスティックの動きをPC上で表現していきます。
Arduinoのピン配置を確認したい方は番外編02を参照してください。
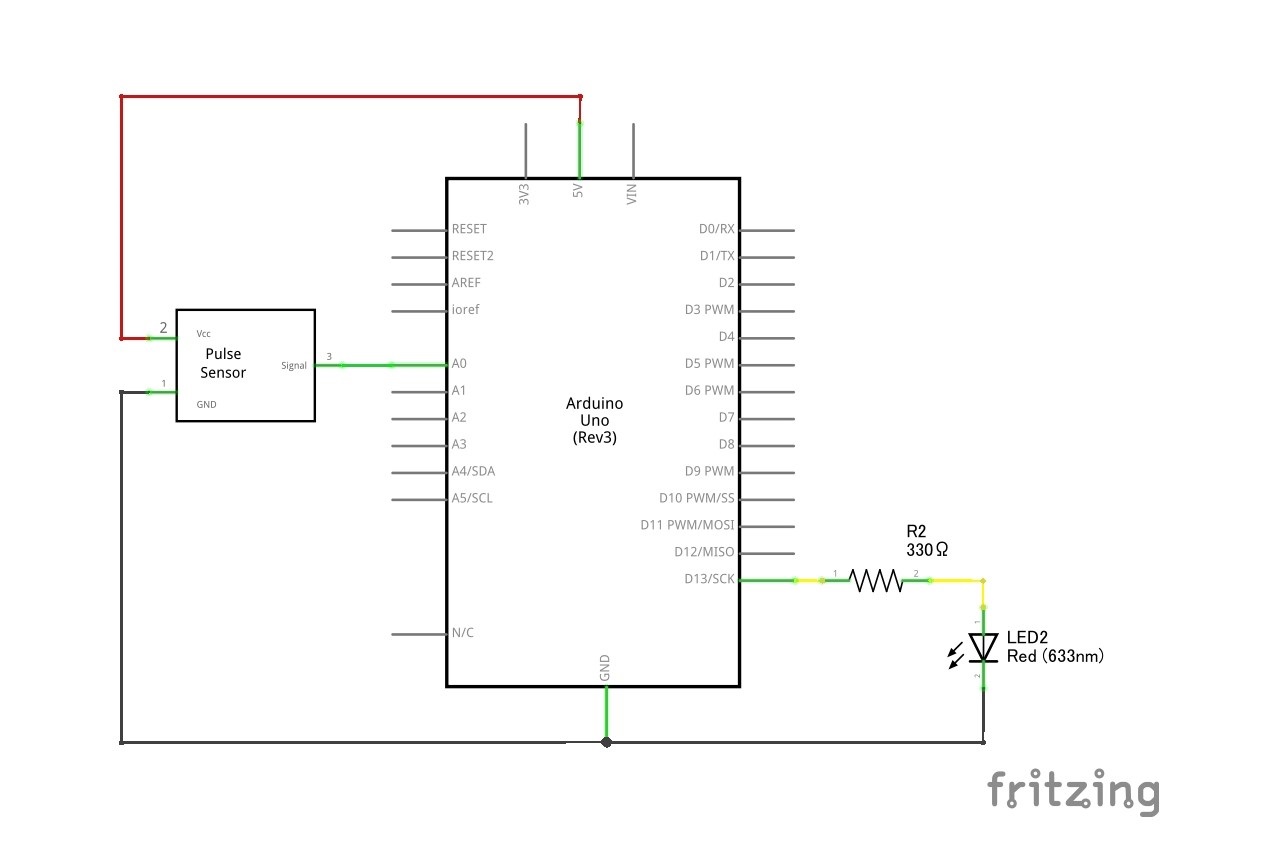
回路図
「脈拍・心拍センサ」のみの回路となります。
Arduino 入門 Lesson 48 【脈拍・心拍センサ その2】と同じ回路です。
利用するピンも同じA0、D13番ピンのみ。
Lチカ不要なら、A0ピンのみでOKです。
あとは、VDDとGNDです。
回路図がこちら。
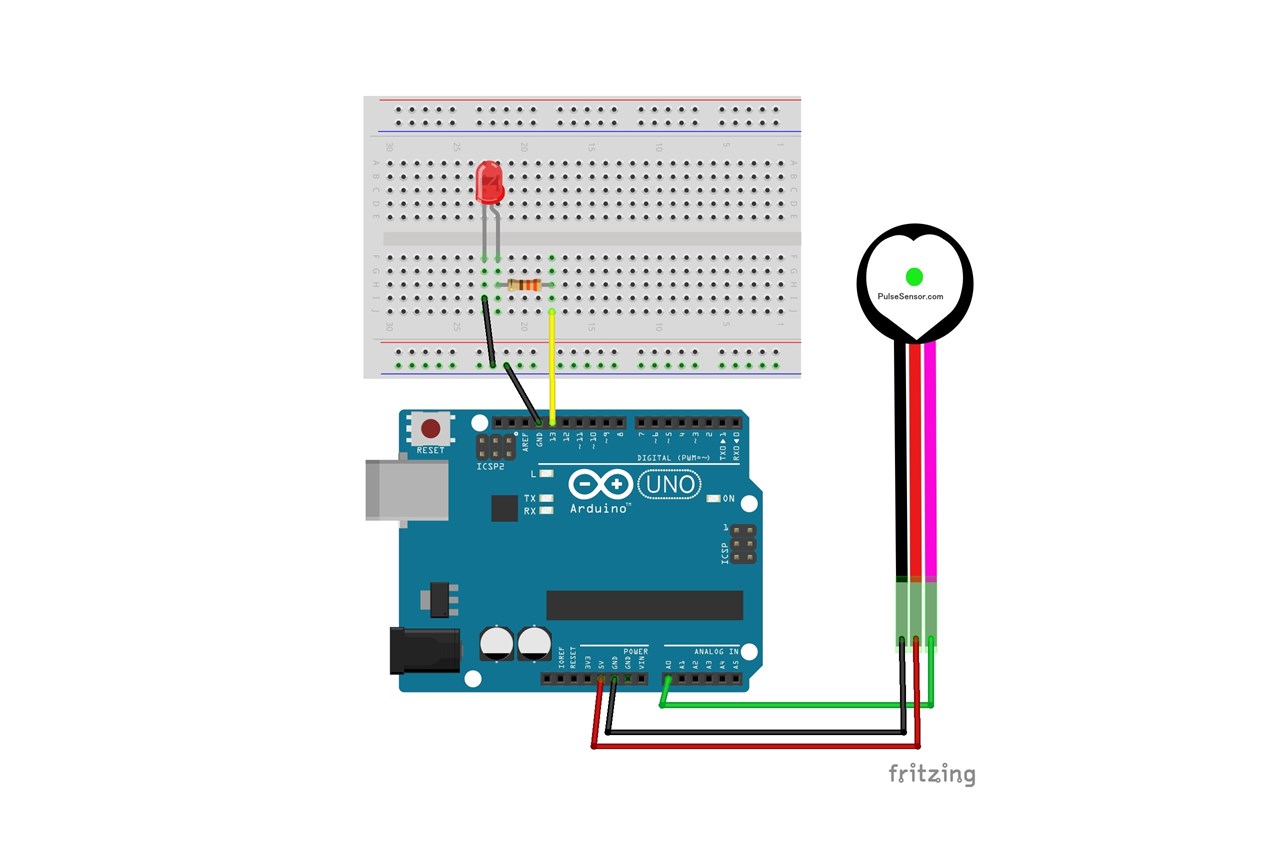
こちらがブレッドボード図。
回路図は「fritzing」を利用しています。
「fritzing」の使い方は下記を参照してください。

接続
下図に示すように、用意した部品を使用して接続しましょう。
部品は脈拍・心拍センサのみのため簡単に接続できます。
使用するポートは、Analog IOの「A0」、Digital IOの「D13」、電源の「5V」「GND」です。
穴に挿入しづらいときは、ラジオペンチなどを使用してください。

Serial入出力のためのクラス 復習
Lesson 14にて解説しましたが、覚えるという意味で再度軽く解説。
Serialクラスの機能を使うためには、「serialパッケージをimport」する。
次に、Serialオブジェクトの生成処理。
生成するためには、Serialクラスのコンストラクタ使用。
parent:通常「this」を使用
portName:ポート番号(COM*) デフォルト:COM1
baudRate:通信速度 デフォルト:9600
Serial Port; //シリアルクラスのオブジェクト、変数の設定
Port = Serial(this, COM3, 9600); //Serialオブジェクト生成、Portへ代入
Serialクラスの主なメソッドを紹介。
| Serialクラス | 内容 |
|---|---|
| available() | 読めるデータのバイト数を返す。 戻り値が0より大きい場合、データを利用できる。 |
| serial.list() | 使用可能なシリアルポートのリストを返す。 |
| read() | 次の1バイトの読み込み。 0~255の値を返す。 読めるバイトがないと-1を返す。 データが使用可能かどうかを確認するために最初にavailable()で確認することを推奨します。 |
| write() | バイト、文字、整数、バイト[]、文字列をシリアルポートに書き込みます。 |
詳しく知りたい方は、公式のホームページで確認!

実践 スケッチ作成
ProcessingとArduinoを連携するためには、お互いにデータのやり取りをする必要があります。
本Lessonのデータのやり取りは、「Arduino」 → 「Processing」。
Lesson 18までとは逆方向、Lesson 19、20、21とは同じ方向になります。
流れとしては以下となります。
- 脈拍・心拍センサの値をArduinoのアナログピンで読み取る。
※AD変換 - 読み取った値をパソコン側へ伝える。(送信)
- 受け取ったデータをProcessingで表現
といった動作!
自作するつもりでしたが、すでにあるサンプルが秀逸であるためご紹介です。
Arduino用 サンプルスケッチ
サンプルスケッチ(コード)を下記に示します。
スケッチは下記でインストールした「PulseSensor Playground」のサンプルを使用します。
Arduino 入門 Lesson 48 【脈拍・心拍センサ その2】
「ファイル」→「スケッチ例」→「PulseSensor Playground」→「PulseSensor_BPM_Alternative」を選択。
Processingで使用するためスケッチの一部を下記へ書き換えてください。
/*
   Sketch to handle each sample read from a PulseSensor.
   Typically used when you don't want to use interrupts
   to read PulseSensor voltages.

   Here is a link to the tutorial that discusses this code
   https://pulsesensor.com/pages/getting-advanced

   Copyright World Famous Electronics LLC - see LICENSE
   Contributors:
     Joel Murphy, https://pulsesensor.com
     Yury Gitman, https://pulsesensor.com
     Bradford Needham, @bneedhamia, https://bluepapertech.com

   Licensed under the MIT License, a copy of which
   should have been included with this software.

   This software is not intended for medical use.
*/

/*
   Every Sketch that uses the PulseSensor Playground must
   define USE_ARDUINO_INTERRUPTS before including PulseSensorPlayground.h.
   Here, #define USE_ARDUINO_INTERRUPTS false tells the library to
   not use interrupts to read data from the PulseSensor.

   If you want to use interrupts, simply change the line below
   to read:
     #define USE_ARDUINO_INTERRUPTS true

   Set US_PS_INTERRUPTS to false if either
   1) Your Arduino platform's interrupts aren't yet supported
   by PulseSensor Playground, or
   2) You don't wish to use interrupts because of the side effects.

   NOTE: if US_PS_INTERRUPTS is false, your Sketch must
   call pulse.sawNewSample() at least once every 2 milliseconds
   to accurately read the PulseSensor signal.
*/
#define USE_ARDUINO_INTERRUPTS false
#include <PulseSensorPlayground.h>

/*
   The format of our output.

   Set this to PROCESSING_VISUALIZER if you're going to run
    the Processing Visualizer Sketch.
    See https://github.com/WorldFamousElectronics/PulseSensor_Amped_Processing_Visualizer

   Set this to SERIAL_PLOTTER if you're going to run
    the Arduino IDE's Serial Plotter.
*/
//const int OUTPUT_TYPE = SERIAL_PLOTTER;
const int OUTPUT_TYPE = PROCESSING_VISUALIZER;

/*
   Pinout:
     PULSE_INPUT = Analog Input. Connected to the pulse sensor
      purple (signal) wire.
     PULSE_BLINK = digital Output. Connected to an LED (and 220 ohm resistor)
      that will flash on each detected pulse.
     PULSE_FADE = digital Output. PWM pin onnected to an LED (and resistor)
      that will smoothly fade with each pulse.
      NOTE: PULSE_FADE must be a pin that supports PWM.
       If USE_INTERRUPTS is true, Do not use pin 9 or 10 for PULSE_FADE,
       because those pins' PWM interferes with the sample timer.
*/
const int PULSE_INPUT = A0;
const int PULSE_BLINK = 13;    // Pin 13 is the on-board LED
const int PULSE_FADE = 5;
const int THRESHOLD = 550;   // Adjust this number to avoid noise when idle

/*
   samplesUntilReport = the number of samples remaining to read
   until we want to report a sample over the serial connection.

   We want to report a sample value over the serial port
   only once every 20 milliseconds (10 samples) to avoid
   doing Serial output faster than the Arduino can send.
*/
byte samplesUntilReport;
const byte SAMPLES_PER_SERIAL_SAMPLE = 10;

/*
   All the PulseSensor Playground functions.
*/
PulseSensorPlayground pulseSensor;

void setup() {
  /*
     Use 115200 baud because that's what the Processing Sketch expects to read,
     and because that speed provides about 11 bytes per millisecond.

     If we used a slower baud rate, we'd likely write bytes faster than
     they can be transmitted, which would mess up the timing
     of readSensor() calls, which would make the pulse measurement
     not work properly.
  */
  Serial.begin(115200);

  // Configure the PulseSensor manager.
  pulseSensor.analogInput(PULSE_INPUT);
  pulseSensor.blinkOnPulse(PULSE_BLINK);
  pulseSensor.fadeOnPulse(PULSE_FADE);

  pulseSensor.setSerial(Serial);
  pulseSensor.setOutputType(OUTPUT_TYPE);
  pulseSensor.setThreshold(THRESHOLD);

  // Skip the first SAMPLES_PER_SERIAL_SAMPLE in the loop().
  samplesUntilReport = SAMPLES_PER_SERIAL_SAMPLE;

  // Now that everything is ready, start reading the PulseSensor signal.
  if (!pulseSensor.begin()) {
    /*
       PulseSensor initialization failed,
       likely because our Arduino platform interrupts
       aren't supported yet.

       If your Sketch hangs here, try changing USE_PS_INTERRUPT to false.
    */
    for(;;) {
      // Flash the led to show things didn't work.
      digitalWrite(PULSE_BLINK, LOW);
      delay(50);
      digitalWrite(PULSE_BLINK, HIGH);
      delay(50);
    }
  }
}

void loop() {

  /*
     See if a sample is ready from the PulseSensor.

     If USE_INTERRUPTS is true, the PulseSensor Playground
     will automatically read and process samples from
     the PulseSensor.

     If USE_INTERRUPTS is false, this call to sawNewSample()
     will, if enough time has passed, read and process a
     sample (analog voltage) from the PulseSensor.
  */
  if (pulseSensor.sawNewSample()) {
    /*
       Every so often, send the latest Sample.
       We don't print every sample, because our baud rate
       won't support that much I/O.
    */
    if (--samplesUntilReport == (byte) 0) {
      samplesUntilReport = SAMPLES_PER_SERIAL_SAMPLE;

      pulseSensor.outputSample();

      /*
         At about the beginning of every heartbeat,
         report the heart rate and inter-beat-interval.
      */
      if (pulseSensor.sawStartOfBeat()) {
        pulseSensor.outputBeat();
      }
    }

    /*******
      Here is a good place to add code that could take up
      to a millisecond or so to run.
    *******/
  }

  /******
     Don't add code here, because it could slow the sampling
     from the PulseSensor.
  ******/
}
Processing用 サンプルスケッチ
こちらも、提供されているサンプルスケッチになります。
下記からダウンロードしてください。
/*
THIS PROGRAM WORKS WITH PulseSensorAmped_Arduino ARDUINO CODE
THE PULSE DATA WINDOW IS SCALEABLE WITH SCROLLBAR AT BOTTOM OF SCREEN
PRESS 'S' OR 's' KEY TO SAVE A PICTURE OF THE SCREEN IN SKETCH FOLDER (.jpg)
PRESS 'R' OR 'r' KEY TO RESET THE DATA TRACES
MADE BY JOEL MURPHY AUGUST, 2012
UPDATED BY JOEL MURPHY SUMMER 2016 WITH SERIAL PORT LOCATOR TOOL
UPDATED BY JOEL MURPHY WINTER 2017 WITH IMPROVED SERIAL PORT SELECTOR TOOL

THIS CODE PROVIDED AS IS, WITH NO CLAIMS OF FUNCTIONALITY OR EVEN IF IT WILL WORK
      WYSIWYG
*/

import processing.serial.*;  // serial library lets us talk to Arduino
PFont font;
PFont portsFont;
Scrollbar scaleBar;

Serial port;

int Sensor;      // HOLDS PULSE SENSOR DATA FROM ARDUINO
int IBI;         // HOLDS TIME BETWEN HEARTBEATS FROM ARDUINO
int BPM;         // HOLDS HEART RATE VALUE FROM ARDUINO
int[] RawY;      // HOLDS HEARTBEAT WAVEFORM DATA BEFORE SCALING
int[] ScaledY;   // USED TO POSITION SCALED HEARTBEAT WAVEFORM
int[] rate;      // USED TO POSITION BPM DATA WAVEFORM
float zoom;      // USED WHEN SCALING PULSE WAVEFORM TO PULSE WINDOW
float offset;    // USED WHEN SCALING PULSE WAVEFORM TO PULSE WINDOW
color eggshell = color(255, 253, 248);
int heart = 0;   // This variable times the heart image 'pulse' on screen
//  THESE VARIABLES DETERMINE THE SIZE OF THE DATA WINDOWS
int PulseWindowWidth = 490;
int PulseWindowHeight = 512;
int BPMWindowWidth = 180;
int BPMWindowHeight = 340;
boolean beat = false;    // set when a heart beat is detected, then cleared when the BPM graph is advanced

// SERIAL PORT STUFF TO HELP YOU FIND THE CORRECT SERIAL PORT
String serialPort;
String[] serialPorts = new String[Serial.list().length];
boolean serialPortFound = false;
Radio[] button = new Radio[Serial.list().length*2];
int numPorts = serialPorts.length;
boolean refreshPorts = false;

void setup() {
  size(700, 600);  // Stage size
  frameRate(100);
  font = loadFont("Arial-BoldMT-24.vlw");
  textFont(font);
  textAlign(CENTER);
  rectMode(CENTER);
  ellipseMode(CENTER);
// Scrollbar constructor inputs: x,y,width,height,minVal,maxVal
  scaleBar = new Scrollbar (400, 575, 180, 12, 0.5, 1.0);  // set parameters for the scale bar
  RawY = new int[PulseWindowWidth];          // initialize raw pulse waveform array
  ScaledY = new int[PulseWindowWidth];       // initialize scaled pulse waveform array
  rate = new int [BPMWindowWidth];           // initialize BPM waveform array
  zoom = 0.75;                               // initialize scale of heartbeat window

 // set the visualizer lines to 0
 resetDataTraces();

 background(0);
 // DRAW OUT THE PULSE WINDOW AND BPM WINDOW RECTANGLES
 drawDataWindows();
 drawHeart();

// GO FIND THE ARDUINO
  fill(eggshell);
  text("Select Your Serial Port",245,30);
  listAvailablePorts();

}

void draw() {
if(serialPortFound){
  // ONLY RUN THE VISUALIZER AFTER THE PORT IS CONNECTED
  background(0);
  noStroke();
  drawDataWindows();
  drawPulseWaveform();
  drawBPMwaveform();
  drawHeart();
// PRINT THE DATA AND VARIABLE VALUES
  fill(eggshell);                                       // get ready to print text
  text("Pulse Sensor Amped Visualizer v1.5",245,30);    // tell them what you are
  text("IBI " + IBI + "mS",600,585);                    // print the time between heartbeats in mS
  text(BPM + " BPM",600,200);                           // print the Beats Per Minute
  text("Pulse Window Scale " + nf(zoom,1,2), 150, 585); // show the current scale of Pulse Window

//  DO THE SCROLLBAR THINGS
  scaleBar.update (mouseX, mouseY);
  scaleBar.display();

} else { // SCAN BUTTONS TO FIND THE SERIAL PORT

  autoScanPorts();

  if(refreshPorts){
    refreshPorts = false;
    drawDataWindows();
    drawHeart();
    listAvailablePorts();
  }

  for(int i=0; i<numPorts+1; i++){
    button[i].overRadio(mouseX,mouseY);
    button[i].displayRadio();
  }

}

}  //end of draw loop


void drawDataWindows(){
    // DRAW OUT THE PULSE WINDOW AND BPM WINDOW RECTANGLES
    noStroke();
    fill(eggshell);  // color for the window background
    rect(255,height/2,PulseWindowWidth,PulseWindowHeight);
    rect(600,385,BPMWindowWidth,BPMWindowHeight);
}

void drawPulseWaveform(){
  // DRAW THE PULSE WAVEFORM
  // prepare pulse data points
  RawY[RawY.length-1] = (1023 - Sensor) - 212;   // place the new raw datapoint at the end of the array
  zoom = scaleBar.getPos();                      // get current waveform scale value
  offset = map(zoom,0.5,1,150,0);                // calculate the offset needed at this scale
  for (int i = 0; i < RawY.length-1; i++) {      // move the pulse waveform by
    RawY[i] = RawY[i+1];                         // shifting all raw datapoints one pixel left
    float dummy = RawY[i] * zoom + offset;       // adjust the raw data to the selected scale
    ScaledY[i] = constrain(int(dummy),44,556);   // transfer the raw data array to the scaled array
  }
  stroke(250,0,0);                               // red is a good color for the pulse waveform
  noFill();
  beginShape();                                  // using beginShape() renders fast
  for (int x = 1; x < ScaledY.length-1; x++) {
    vertex(x+10, ScaledY[x]);                    //draw a line connecting the data points
  }
  endShape();
}

void drawBPMwaveform(){
// DRAW THE BPM WAVE FORM
// first, shift the BPM waveform over to fit then next data point only when a beat is found
 if (beat == true){   // move the heart rate line over one pixel every time the heart beats
   beat = false;      // clear beat flag (beat flag waset in serialEvent tab)
   for (int i=0; i<rate.length-1; i++){
     rate[i] = rate[i+1];                  // shift the bpm Y coordinates over one pixel to the left
   }
// then limit and scale the BPM value
   BPM = min(BPM,200);                     // limit the highest BPM value to 200
   float dummy = map(BPM,0,200,555,215);   // map it to the heart rate window Y
   rate[rate.length-1] = int(dummy);       // set the rightmost pixel to the new data point value
 }
 // GRAPH THE HEART RATE WAVEFORM
 stroke(250,0,0);                          // color of heart rate graph
 strokeWeight(2);                          // thicker line is easier to read
 noFill();
 beginShape();
 for (int i=0; i < rate.length-1; i++){ // variable 'i' will take the place of pixel x position vertex(i+510, rate[i]); // display history of heart rate datapoints } endShape(); } void drawHeart(){ // DRAW THE HEART AND MAYBE MAKE IT BEAT fill(250,0,0); stroke(250,0,0); // the 'heart' variable is set in serialEvent when arduino sees a beat happen heart--; // heart is used to time how long the heart graphic swells when your heart beats heart = max(heart,0); // don't let the heart variable go into negative numbers if (heart > 0){             // if a beat happened recently,
      strokeWeight(8);          // make the heart big
    }
    smooth();   // draw the heart with two bezier curves
    bezier(width-100,50, width-20,-20, width,140, width-100,150);
    bezier(width-100,50, width-190,-20, width-200,140, width-100,150);
    strokeWeight(1);          // reset the strokeWeight for next time
}

void listAvailablePorts(){
  println(Serial.list());    // print a list of available serial ports to the console
  serialPorts = Serial.list();
  fill(0);
  textFont(font,16);
  textAlign(LEFT);
  // set a counter to list the ports backwards
  int yPos = 0;
  int xPos = 35;
  for(int i=serialPorts.length-1; i>=0; i--){
    button[i] = new Radio(xPos, 95+(yPos*20),12,color(180),color(80),color(255),i,button);
    text(serialPorts[i],xPos+15, 100+(yPos*20));

    yPos++;
    if(yPos > height-30){
      yPos = 0; xPos+=200;
    }
  }
  int p = numPorts;
   fill(233,0,0);
  button[p] = new Radio(35, 95+(yPos*20),12,color(180),color(80),color(255),p,button);
    text("Refresh Serial Ports List",50, 100+(yPos*20));

  textFont(font);
  textAlign(CENTER);
}

void autoScanPorts(){
  if(Serial.list().length != numPorts){
    if(Serial.list().length > numPorts){
      println("New Ports Opened!");
      int diff = Serial.list().length - numPorts;	// was serialPorts.length
      serialPorts = expand(serialPorts,diff);
      numPorts = Serial.list().length;
    }else if(Serial.list().length < numPorts){
      println("Some Ports Closed!");
      numPorts = Serial.list().length;
    }
    refreshPorts = true;
    return;
  }
}

void resetDataTraces(){
  for (int i=0; i<rate.length; i++){
     rate[i] = 555;      // Place BPM graph line at bottom of BPM Window
    }
  for (int i=0; i<RawY.length; i++){
     RawY[i] = height/2; // initialize the pulse window data line to V/2
  }
}
動作確認
では、さっそく動作を確認していきます。
- Arduinoへスケッチ書き込み
- Processingスケッチ実行
- 脈拍・心拍センサに指をあてる
- Processingの画面で脈拍・心拍が測定できていることを確認
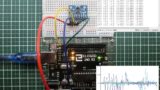
実行するとProcessingのウィンドウ画面があらわれます。
心拍の波形、BPM、IBIが測定できます。
■Processingの画面
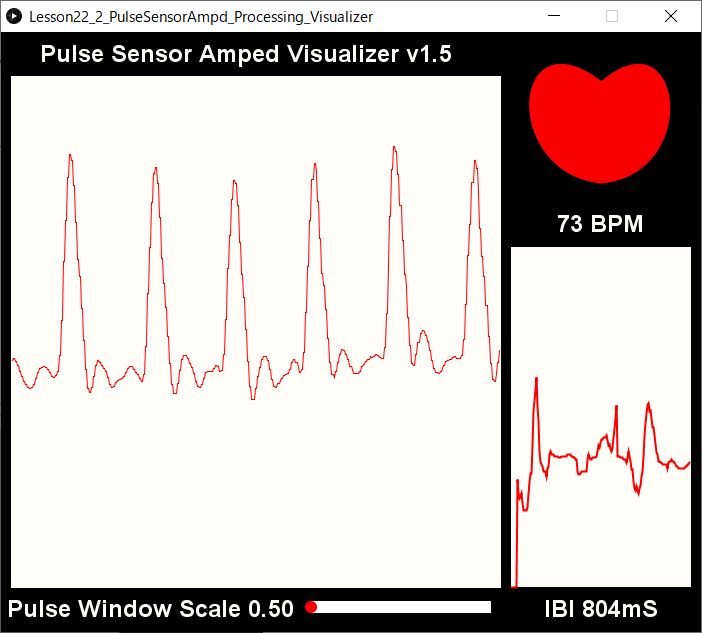
さすがに、自作でここまで作るのは片手間では難儀です・・・。
サンプル秀逸です!
学習のために、もう少し簡単なものを今後自作したいと考えています。
本Lessonでも、データ方向「Arduino」 → 「Processing」を理解するために簡単な電子部品で遊んでみました。
次回も、「Arduino」 → 「Processing」の理解を深めていきます。
今回は、サンプルスケッチの紹介でした。
学習のために、もう少し簡単なスケッチで自作できればと考えています。
まとめ
Processing 入門 Lesson 22【脈拍・心拍センサ】はここまで。
本Lessonでは以下の2つについて目標としました。
2.脈拍・心拍センサの復習
3.脈拍・心拍センサで取得した脈拍・心拍の動きをProcessingで表現する
本Lessonはサンプルの紹介になってしましました。
次回は、もう少し簡単なスケッチで自作しようかと考えています。
学習のために。。。
次回Lesson 23以降も引き続きArduino→Processingについて学習していきます。
Lesson 23は【超音波距離センサ】です。

Processingを始めようと考えている方。
ネット情報のみでも十分に学習可能です。
手元に参考書がほしいと考えている場合は下記の2冊程度で十分と考えます。
最後に
疑問点、質問などありましたら気軽にコメントください。
この電子部品の解説をしてほしい!などなどなんでもOKです。
リンク切れ、間違いなどあればコメントいただけると助かります。
Arduino入門編、番外編、お役立ち情報などなどサイトマップで記事一覧をぜひご確認ください。
Arduino入門編、Arduino入門編2で使用しているUNOはAmazonにて購入可能です。
Arduino入門編では互換品を使用。
Arduinoはオープンソース。
複製して販売するのもライセンス的に問題なし。
そのため互換品の品質も悪くなく、それでいて値段は安いです。
正規品本体の値段程度で豊富な部品が多数ついています。
学習用、遊び用、お試し用には安価な互換品がおすすめです。
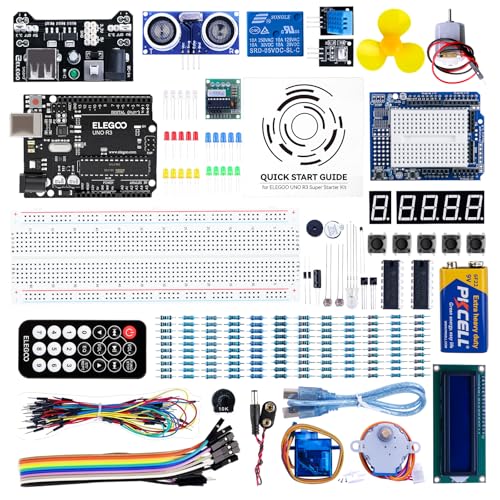
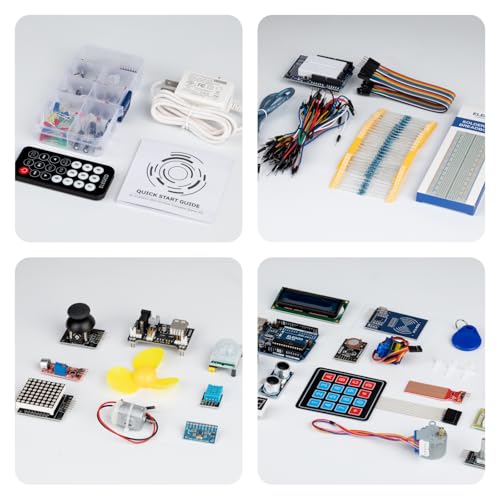
ELEGOO UNO キット レベルアップ チュートリアル付 uno mega2560 r3 nanoと互換 Arduino用


上記のものでも十分に多数の部品が入っていますが、最初からもっと多数の部品が入っているこちらもお勧めです。


Arduino入門編2では「Arduino UNO R4 Minima」「Arduino UNO R4 WIFI」にて遊ぶため今のところは正規品を使用。(まだ互換品が・・・ほぼない)


Amazonでお得に買う方法
Amazonでお得に購入するならAmazon Mastercard、Amazonギフト券がおすすめです。
時期により異なりますが、様々なキャンペーンを実施しています。
\Amazonギフト券/
Amazonギフトカード キャンペーン
\Amazon Mastercard お申込み/
Amazon Mastercard 申し込み
いずれの場合もプライム会員である方がお得!!
\Amazon Prime 30日間の無料会員を試す/
無料会員登録


コメント